Tag Archives: residence halls

Mead Hall Elevator


Loading map...

Loading


Reverberation:

Mead Hall is located near the center of Pitzer College’s campus. Mead is build as four towers, connected by elevated walkways. The northwestern tower is named W and in clockwise order the other towers are named X, Y and Z. Mead is the oldest building on campus that houses students and the only elevator in the complex is located in Y tower. The elevator is dimly lit and smells of stale air. Above the door there are several empty bottles wedged between the light and the ceiling. The linoleum floor is chipped, the walls are imitation wood, and only decorated by a lone, empty cork board. Since the time of this recording the elevator has been refurnished with metal panelling and although it is arguably more aesthetically pleasing, it has broken several times and is frequently out of service.

Reverb-Pitzer-map

Reverberation time:

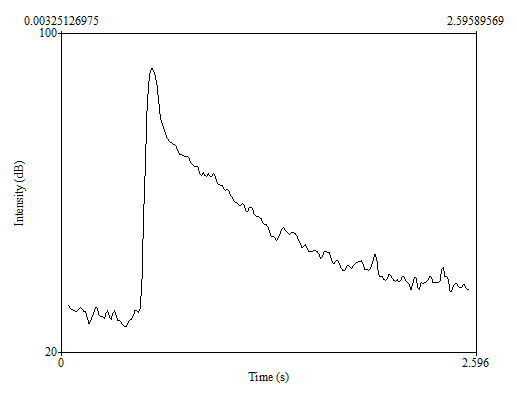
30dB decay: .2 seconds

50dB decay: .5 seconds

60dB decay: .7 seconds

decay to background level: 2.9 seconds

Acoustic description:

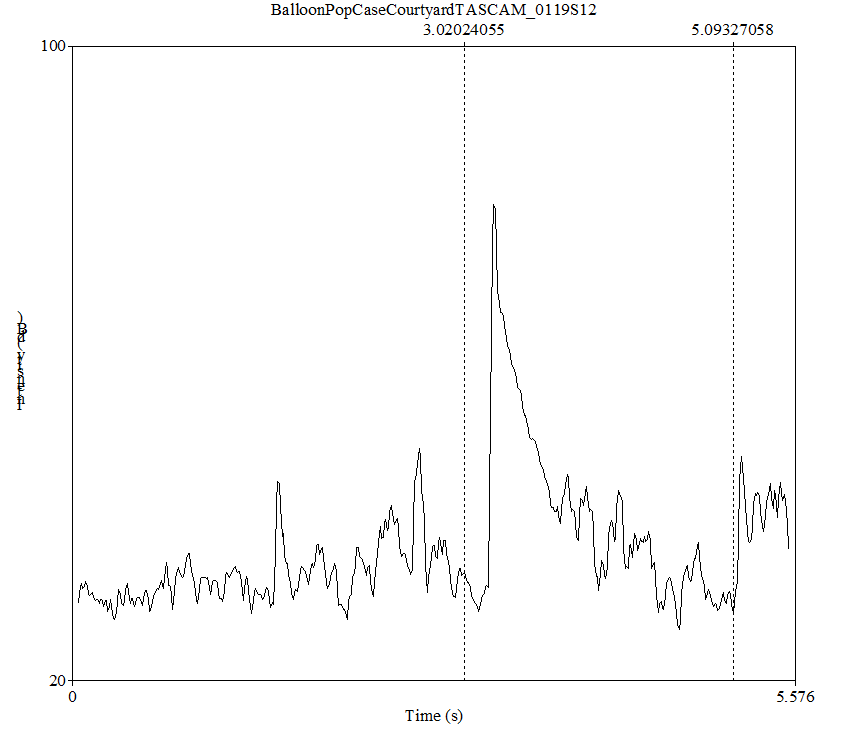
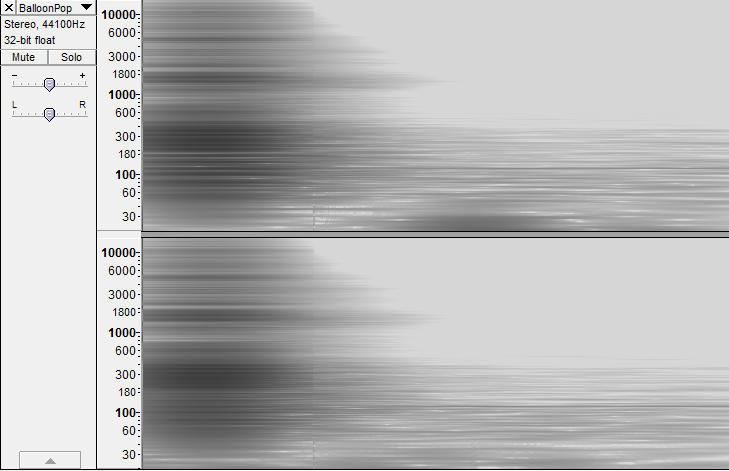
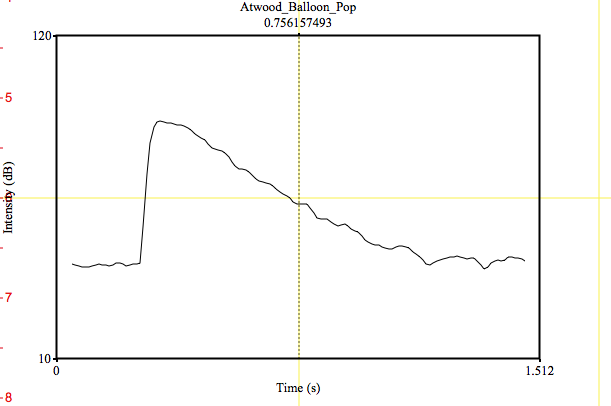
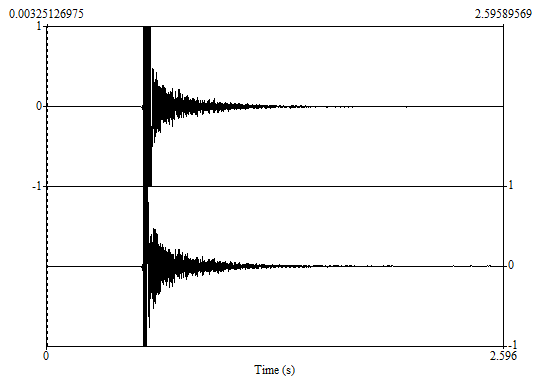
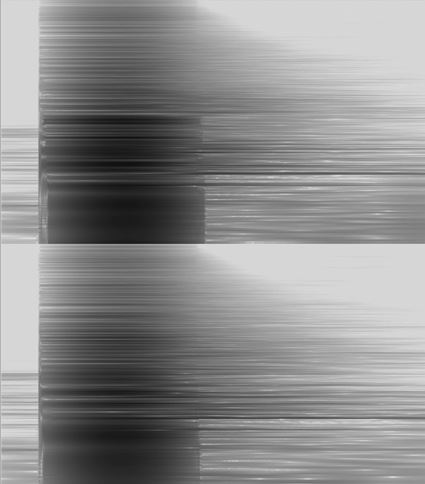
For this recording I set up the TASCAM DR-40 recorder on the floor using the tripod for stability and held the balloon 3 feet in the air above the microphone. At 10:45am on march 31st residents of  Mead’s Y Tower heard a loud BANG (3 actually since the first two popped prematurely)!!! I expected the small, enclosed space of the elevator to reverberate the pop for longer than it did. The spectrogram shows the high frequency decayed relatively quickly, by .8 seconds, compared to the low frequencies, which took 3 seconds. I know cork is a very absorbent substance, and it may have contributed to the quick decay. I imagine the mechanical workings of the elevator contributed to a slightly elevated baseline. The intensity graph shows a series of fluctuations in intensity which take place at the end of the decay and this could have been from the elevator’s many moving mechanics, or it could be a result of the space’s reflective sound qualities.

Case Courtyard Feb. 4, 2014


intensity

sound

spectogramLog

80.5 dB (maximum intensity @ 3.2s)
50.6 dB (@ 3.5s)
30.7 dB (@ 4.5s)
26.5 dB (minimum intensity @ 4.7s)


This recording was taken at Case Courtyard, which is an outdoor space but surrounded by a two-story brick building in all four sides (except an opening in the North West corner). Its concrete floor (ground) and the surrounding walls probably cause any reverberant sound to bounce/rise upward. At the time of recording, there were two wooden tables out in the courtyard. There were two people in the area including myself and another person holding up the balloon.

According to the data, it took 1.5 seconds for the balloon pop to decrease from the maximum intensity, 80.5 dB, to the minimum intensity, 26.5 dB. The difference between the two extrema is 54.0 dB, which is somewhat close to 60 dB. At the time of recording, the person who was holding the balloon spoke soon after the balloon pop (within the first 10 seconds after the pop, and closer to where the minimum intensity was taken from). For this reason, I had to cut out the very end of the recording. This may have prevented us from seeing the decibel volume decrease even more.

Atwood Dorm Bathroom Balloon Pop

Location: This recording was taken in the bathroom of one of the suites on the third floor of Atwood Dorm at Harvey Mudd College.

Description of the space: Atwood dorm is known for its gigantic bathrooms. For this recording stood in the shower, which is about 1.5 m wide and 1.5 meters long. There is a door leading into the bathroom hallway that has two sinks. Past the sinks there is a room with a door inside of which there is a toilet. Across from the toilet door is the entrance to the bathroom. The recording device was on a tripod at about chest level attached to one of the towel racks outside the shower. It was about 2 meters away from me.

Reverberation time:

Maximum intensity: 90.99 dB

30 dB drop: 61.4 dB @ 0.5 s

50 dB drop: 40.8 dB @ 1.0 s

Minimum Intensity: 40.8 dB @ 1.1s

Back to ambient: 44 dB @ 1.1 s

Acoustic Description: I expected the bathroom to have a longer reverb time but surprisingly this bathroom dampens the balloon pop sound rather quickly. One explanation for this could be that the bathroom is actually composed of porous concrete blocks (a material used in most Harvey Mudd buildings). Since this material has a lot of holes, it does not reflect sound well and thus reduces the reverb. Furthermore, I placed the recorder outside of the shower so the reverb may have been lost. The decay time was neither long nor short; it only took 1.1 s to reach its minimum intensity, which was also the region of ambient sound. The greatest source of background noise was the bathroom fan that was actually quite loud. This explains why the ambient sound level is so high. As can be seen on the spectrogram, even after the balloon pop, there are a lot of frequencies in the low to mid register.


reverb-atwood-bathroom-intensity reverb-atwood-bathroom-spectrogram reverb-atwood-bathroom-waveform[a

Acoustic Space: Scripps–Kimberly basement

Media.

Description of the space.
The acoustic space chosen was the basement of Kimberly—one of the dorms on Scripps campus. To get to the basement, one must go down a set of narrow concrete stairs. There is a laundry room directly in front of the staircase and the basement continues onward as a long hallway with various locked rooms for storage. The end of the basement hallway—furthest from the laundry room—was chosen as the location for the balloon pop.

Recording setup and recording device.
An 18” balloon was popped and recorded using a TASCAM DR-40 SOUND RECORDER. The recorder was held about one foot away from the balloon during recording. The microphone was pointed directly at the balloon where the puncture was made. This recording was made on Wednesday, February 19th 2014 at 8:00pm.

Reverberation time.

Maximum Intensity: 91.18 dB
Minimum Intensity: 26.52 dB
30dB drop after 1.07 s
50dB drop after 1.81 s
Reached minimum intensity after 0.43 s
Reached maximum intensity after 0.60 s
Returned to pre-pop intensity level after 3.33 s

Acoustic description.
Using Audacity, the balloon pop recording was cut when the waveform diagram appeared to return to pre-popping conditions. The Audacity waveform diagram of this recording is identical to the one generated using Praat.

Graph of sound waveform generated using Praat.

However, the Visible Intensity Contour plot demonstrates that the reverberations had not quite ceased yet.

Visible Intensity Contour plot was generated using Praat.

This is evident from the spectrogram as well.

Spectrogram generated using the Audacity.

The shading before and after the pop are not quite the same shade—meaning the recording was cut a bit short. Despite the premature cut off, the long-lasting reverb tells us that the acoustic space is likely to be narrow and made of material that readily reflects sound (rather than absorbs the sound).