Loading map...

Description of the Space
The event occurred in the middle of the Pomona Track. Picture a classic running track: an open grassy field surrounded by an oval track of probably a quarter mile circumference, and the land surrounding the track is slightly elevated forming a shallow bowl shape. There is also a rectangular metal equipment shed on the side of one of the straightaways of the track, probably 20 feet long.
Recording Setup / Recording Device
An 18” balloon was popped and recorded using a TASCAM DR-40 sound recorder. I stood in the center of the track and popped the balloon while a pal recorded the event with the microphone about 3 feet from the balloon and pointed in its direction. The pop was recorded on Wednesday, March 5 2014 at 9:00pm.
Reverberation time
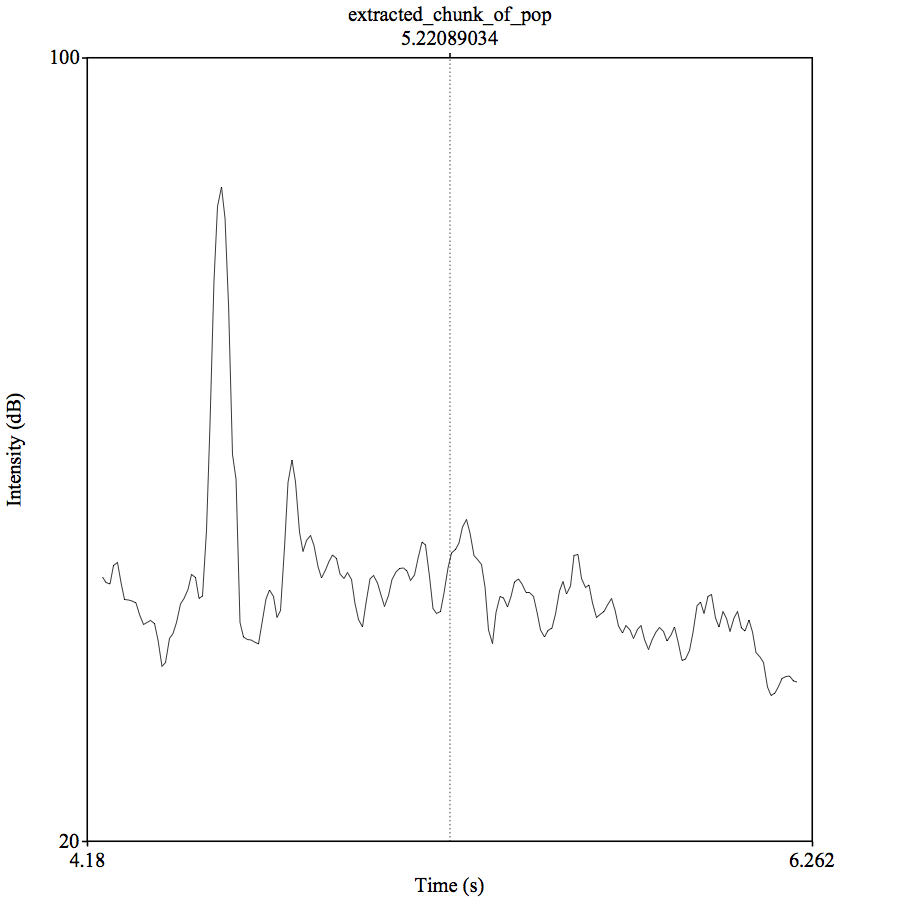
-Maximum Intensity: 86.85 dB
-Minimum Intensity: 34.91 dB
-30dB Decay: .03 s
-50dB Decay: 1.56 s
-Return to Background Level: 1.7 s
Acoustic Description
Using Pratt, the recording was edited down from just a moment before the pop to when the audio returns to its pre-pop levels. The visible sound graph that we get shows the sudden spike of the initial pop and its extremely brief decay, then a moment of near silence before we see a considerably softer but distinct echo. I’m quite sure that single echo is coming off of the equipment shed that stands on one side of the track.
The visible intensity contour plot gives us a similar image. There is the initial spike followed by a steep drop and then the clearly audible echo, which we can now see is just about half as loud as the initial event. The echo quickly dissipates back to the pre-pop background levels.
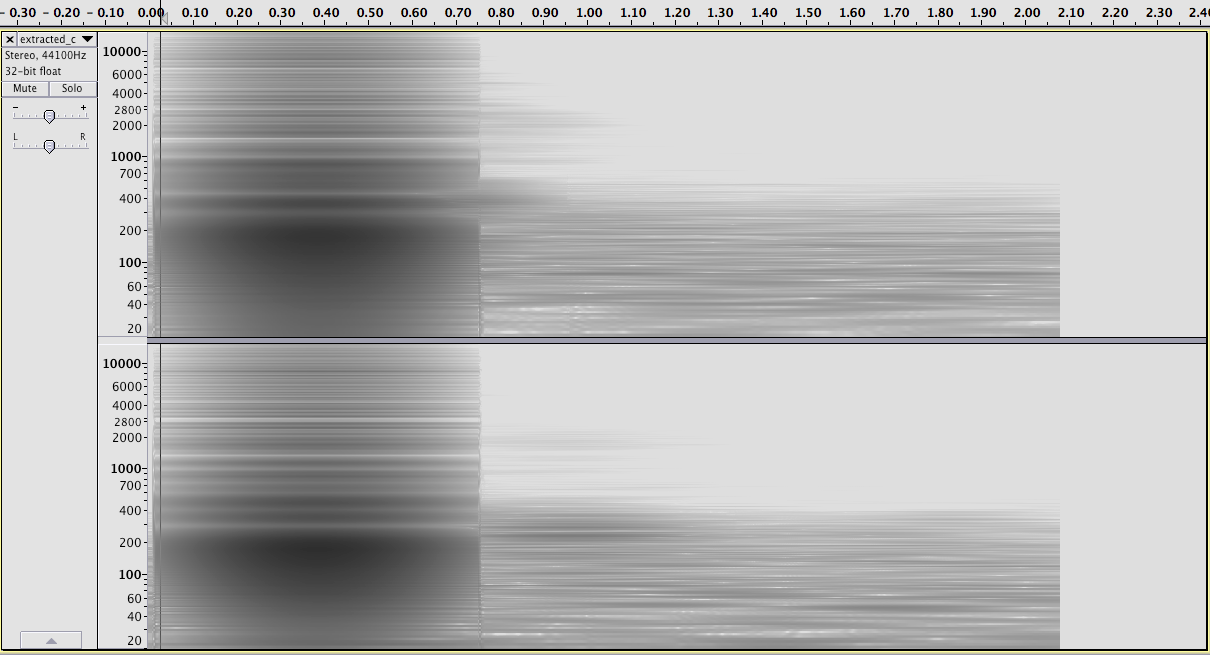
Again the same sonic event is visualized in the spectrogram. The initial pop makes up the massive window of frequency in the beginning, which immediately drops into the much softer echo and then decay.